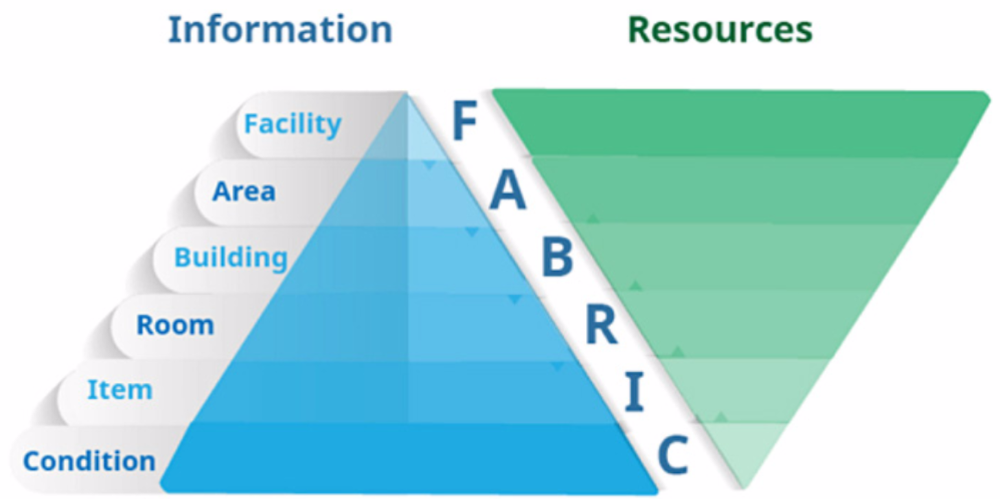
The difference between data and actionable information lies in how that information is organized. The basic idea behind the FABRIC information organization model is that the more specific the information available, the fewer labor and other resources needed to both respond to a problem and to implement innovations to prevent performance failures.
As suggested by the FABRIC model, if you know that no one is happy or that quality is awful, you’ll spend a lot of time and resources to fix everything that might be wrong.
On the other hand, if you know that the problem is:
You’ll spend the least time and resources to fix and prevent this service failure. In reality, the more granular the information, the fewer resources and time are needed to both fix and prevent service problems.
The Performance-Driven Report system which follows has been designed to present performance information in a logical general-to-specific format. It is designed to enhance the focus on identifying opportunities and preventing service failure for the program’s KPIs: Quality, Organic Load, Cost, and Customer Satisfaction performance.
Let’s begin with an example. Consider the following question: Where does building soiling come from? See the graphic below. There are three categories of soiling, as determined by their cause:
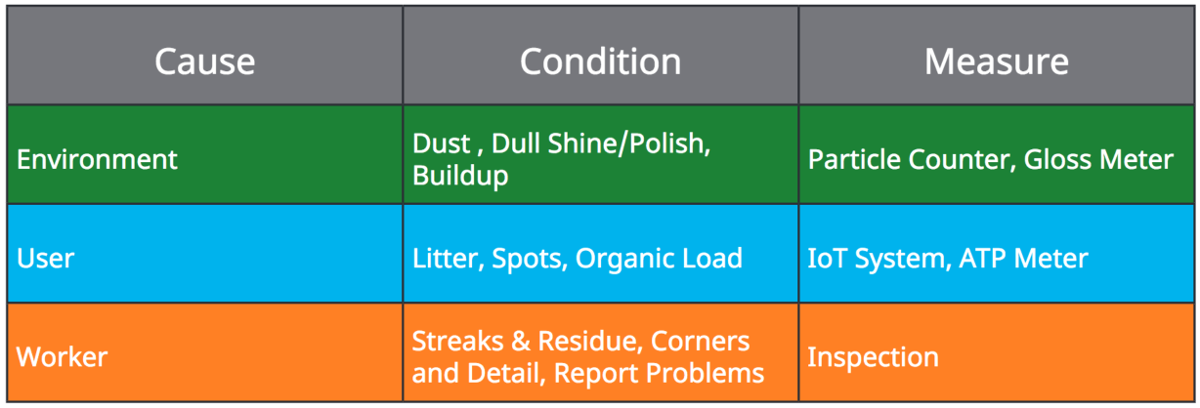
As the chart above shows, the cause for “dirty” facilities can come from the Environment, Users, and Workers. The first two—Environment- and User-caused conditions—are more predictable but less controllable than Worker-caused defects, as Workers can be trained. However, both the Environment- and User-caused conditions can be predicted, and what can be predicted can be prevented.
The goals of the Reporting system is to organize information to identify opportunities to prevent Environmental, User, and Worker-created performance problems.
The report uses the color RED to direct managers to opportunities of improvement. These red markers are shown in Circles, Bar Charts, Table Cells, Text and Numbers.
 if a circle is RED, this Metric fails to meet the expected standard. Diving deeper into the cause and the trend of the failure will determine what action the manager needs to take.
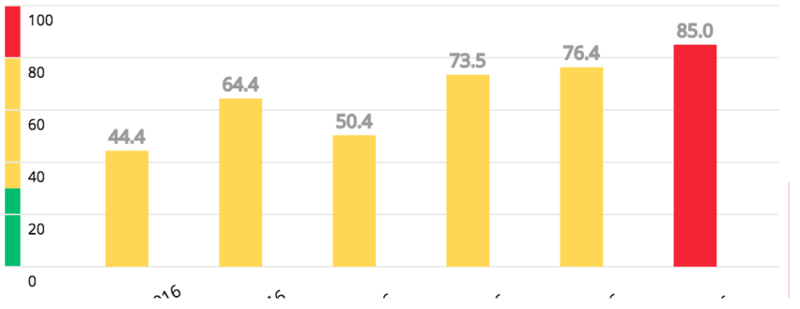
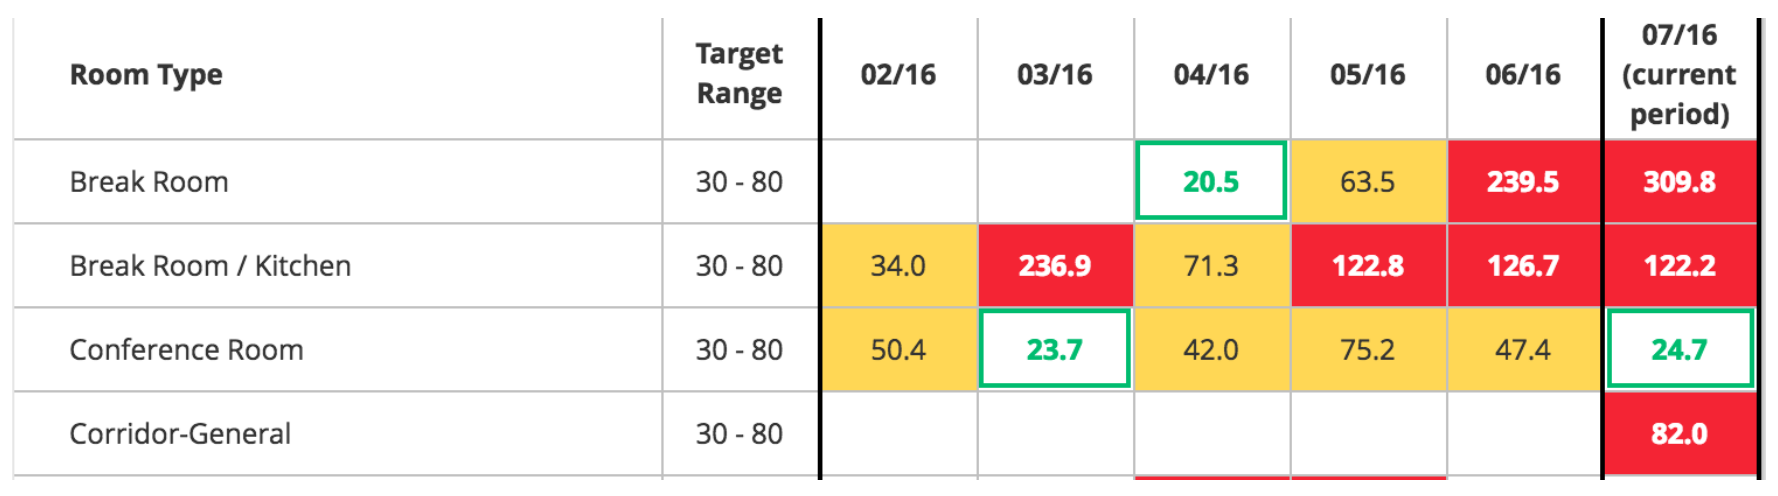
Throughout the report, you will find Bar Charts and Tables of Cells. They quickly provided a current period rating and a trend. The trend indicates the action that would follow from this report.
Special cause: One Red period should prompt the manager to have and document a conversation with their Supervisors.
Special cause: Two Red periods would prompt coaching and training of Supervisors.
Common cause: Three or more Red periods would prompt a proposal and review of a system change.
Next help article: Report Organization